Data Handling - Worksheets
CBSE Worksheet-01
Class - IV Mathematics – Data Handling
Time Allowed: 30 minutes
- Fill in the blanks with suitable words:
- Collecting, representing and interpreting simple data is called __________ .
- In a Pictograph, If
 = 3 cars , then = ________________ cars.
 - In a Bar Graph, the horizontal axis is known as the __________ .
- 'THERE IS LOCKDOWN IN INDIA DUE TO COVID-19'.
Write the Tally Marks for vowel 'O' in the above statement. - Preeti has an equal number of Apples and mangoes, If the number of apples she has is represented by a semi-circle in a Pie Chart, then the other semicircle of the Pie Chart represents _________.
- State whether each of the following statement is True or False:
- In a Bar Graph, the smallest bar represents the least/minimum quantity of data.
- Tally Marks for the number of students who like Chess is
IIIIIIIIII. It means the number of students are 12. - Pie Charts are circular and are divided into sectors to represent data.
- A bar graph represents data in the form of pictures, objects, or parts of objects.
- In a Pictograph, scale is 1
 = 3 ice-creams. Then, 9 Ice-creams Rahul had can be represented by .
- Which flavor got 5 votes?
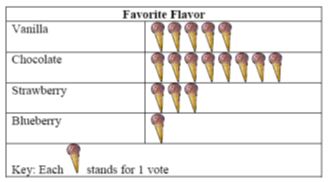
- Chocolate
- Vanilla
- Blueberry
- Strawberry
- How many toys were sold on Tuesday, Thursday, and Saturday?
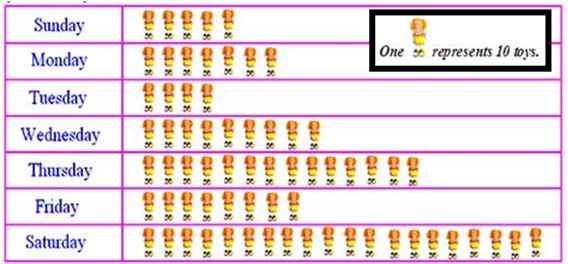
- 300
- 38
- 240
- 380
- How many children are collecting dresses?
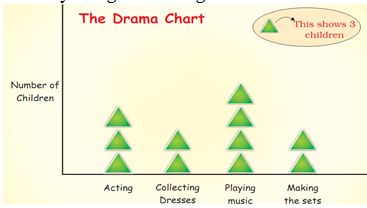
- 9
- 6
- 8
- 7
- The ages in years of 10 teachers of a school are 32, 41, 28, 54, 35, 26, 23, 33, 38, 40. What is the age of the youngest teacher?
- 22 years
- 23 years
- 25 years
- 21 years
- Which book got the fewest number of votes?
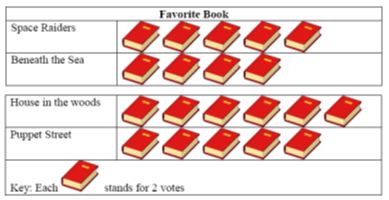
- Beneath the sea
- Puppet street
- Space raider
- House in the woods
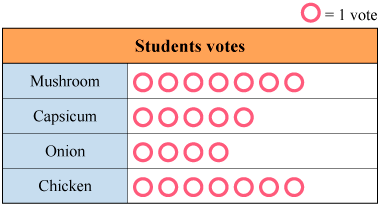
- Dhaval surveyed his classmates to find their favorite fruits. he made a tally chart to record the results.
BANANA 
APPLE 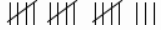
MANGO 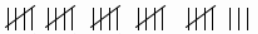
GRAPES 
Match the following based on the above information:
(a) Number of students whose favourite fruit is banana. (i) 17 (b) Number of students whose favourite fruit is apple. (ii) 28 (c) Number of students whose favourite fruit is mangos. (iii) 18 (d) Number of students whose favourite fruit is grapes. (iv) 21 Few students voted for their favourite pizza topping. Which two toppings received equal votes?
The mode of transport used by Class IV students to commute to school is as below. Draw the pictograph with a suitable scale.
Mode of Transport Number of Students 1. Van 14 2. Car 10 3. Auto 8 4. School Bus 28 The total number of students of a school in different years is shown in the following table:
Year 1996 = 400 students
Year 1998 = 500 students
Year 2000 = 600 students
Year 2002 = 800 students
Prepare a pictograph of students using symbol to represent 100 students.
A kid's library had 25 Fairy Tales Books, 35 Adventure Stories Books, 15 Science Fiction Books, and 25 Art Books.
- Draw Pictograph with a suitable scale.
- How many books in all the Kids Library have?
The number of patients admitted to hospital is given below: (Scale 1
 = 4 Patients)
- Find the number of patients admitted during the week.
- The number of patients admitted on Friday.
Days of the Week
Patients admitted
Monday
Tuesday
Wednesday
Thursday
Friday
Saturday
The graph shows the amount of rainfall in five months: Read the bar graph and answer the questions:
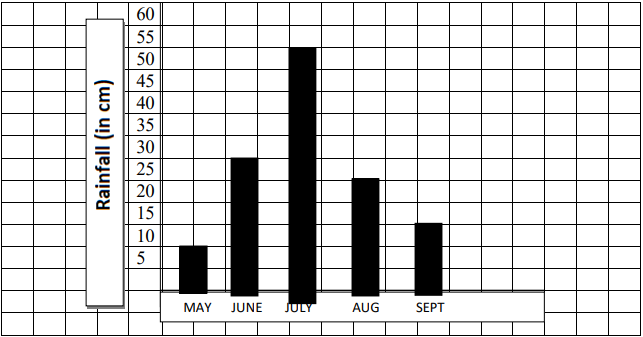
- How much did it rain in September?
- How much did it rain more in July than in May?
- What was the total rainfall in 5 months?
- What was the maximum and minimum rainfall? Name the months for the same.
Given below are the numbers of bicycles sold by a store over five months.
Months Number of Bicycles January 4500 February 2000 March 3500 April 5000 May 4000 - Represent the table in the form of a pictograph.
- Select the appropriate title for the pictograph
- How many more bicycles were sold in March than in February?
- Which month showed the maximum number of sales?
The graph below shows the grades of students of Class 4.
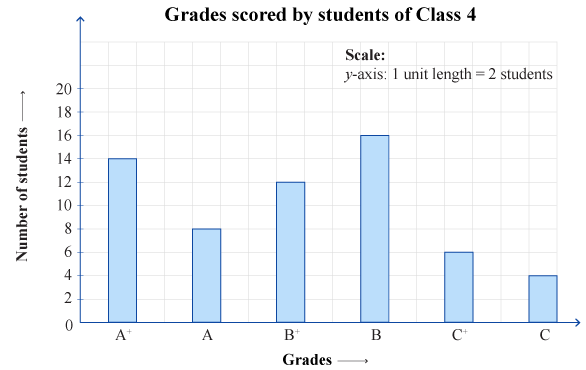
- Which grade was scored by most of the students?
- How many students got either A or A+?
- what is the total strength of the class?
- How many students scored above B?
- If failed students are given grade C, then how many students of Grade 4 must have failed?
CBSE Worksheet-01
Class - IV Mathematics – Data Handling
Solution
Fill in the blanks with suitable words:
Data Handling.
15 Cars., 1
=3 cars, so = 5 3 = 15 Cars.X-axis.
IIII, (4) The vowel 'O' occurs four times in the above statement.
Mangoes. ( The circle in a Pie Chart represents Whole Data.)
State whether each of the following statement is True or False:
True.
True.
True.
False; A pictograph represents data in the form of pictures, objects, or parts of objects.
True. If 1
= 3 ICE-CREAMS, Rahul had = 3 3 =9 Ice-creams.
- (b) Vanilla
Explanation: Vanilla flavor got 5 votes. - (d) 380
Explanation:Number of toys sold on Saturday = 20 10 =200
Number of toys sold on Tuesday = 4 10 =40
Number of toys sold on Thursday = 14 10 = 140
Total toys were sold on Tuesday, Thursday and Saturday = 200 + 40 + 140 = 380 - (b) 6
Explanation: Total number of children collecting dresses = 2 3 = 6 children - (b) 23 years
Explanation: Less number = 23
So the age of youngest teacher = 23 years. - (a) Beneath the sea
Explanation:Number of children voted for Space Raiders = 5 2 = 10 children
Number of children voted for Beneath the Sea = 4 2 = 8 children
Number of children voted for house of the wood = 6 2 = 12 children
Number of children voted for Puppet Street = 5 2 = 10 children
Beneath the sea got fewest number of votes. (a) – (iv), (b) – (iii), (c) – (ii), (d) – (i)
Mushroom and chicken
Scale 1
 =2 Students
Mode of Transport Number of Students 1. Van 2. Car 3. Auto 4. School Bus using
= 100 students
then, the pictograph would be:Years Number of students 1996 1998 2000 2002 Scale 1
 =5 books.
Type of Books
Number of Books
Fairy Tales Books
Adventure Stories Books
Science Fiction Books
Art Books
(ii) The Kids Library had 100 Books.
- 80 Patients
- 24 Patients ( 1 = 4 Patients , so 6 4 = 24 patients)
- According to graph, there is 10 cm rainfall recorded in the month of September.
- According to the graph, in July month rainfall recorded = 55 cm
in the month of May = 10 cm, rainfall recorded
So, difference of rainfall between July and May = 55 - 10 = 45 cm - According to graph, in May 10 cm, in June 30, in July 55 cm, in August 25 cm and in September 15cm So, total rainfall in 5 months = 10 + 30 + 55 + 25 + 15 = 135 cm
- According to the graph,
Maximum rainfall is in the month of July which is 55 cm recorded.
Minimum rainfall is in the month of May which is 10 cm recorded.
January @ @ @ @ @ @ @ @ @ February @ @ @ @ March @ @ @ @ @ @ @ April @ @ @ @ @ @ @ @ @ @ May @ @ @ @ @ @ @ @ - @=500
- Bicycles sold from January to May
- 1500
- April
- B
- 22
- 60
- 34
- 4